top of page
Patient Presentation: A 23-year-old obese female was diagnosed with idiopathic intracranial hypertension (IIH) and referred to neurosurgery for ventriculoperitoneal shunt. A baseline ocular examination was performed prior to the procedure.
On examination, vision was 20/200 in the right eye, and 20/40 in the left eye. There was a right relative afferent pupillary defect. Slit lamp examination was normal.
A dilated fundus examination was performed demonstrating the following:
.png)
Glaucoma
Case 7
Patient Presentation: An 82-year-old female with mild primary open angle glaucoma presents to her ophthalmologist for follow-up. Her visual acuity was 20/30 OU. IOP was 16 OD and 18 OS. Visual field and OCT were stable in the right eye. Analyses of the rates of change in RNFL thickness, ganglion cell complex (GCC) thickness, and Humphrey visual field mean deviation (MD) in the left eye are shown below:
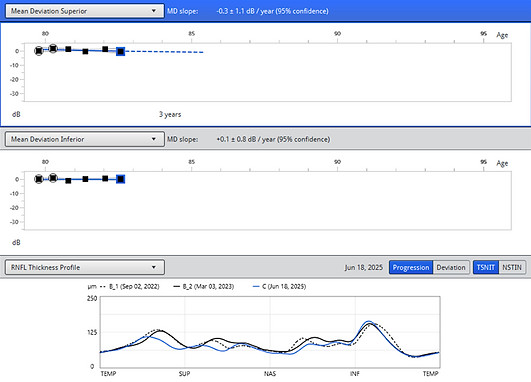

Question 1: What is the best way to describe the metrics in the rate of change analysis in the left eye?
Question 2: What aspects of the rate of change analysis would go against glaucoma progression in the left eye?
The full ONH/RNFL OCT printout was analyzed and is shown below:

Question 3: How would you describe the quality of the OCT RNFL?
Repeat OCT ONH/RNFL was performed and is shown below:

A comparison of the OCT ONH/RNFL analysis with the motion artefact and a repeat test performed on the same patient is shown below. The uninterrupted path of the superior arcuate vessels exiting the disc, as well as normal superior RNFL thickness and deviation map, are visible in the reliable analysis. The RNFL circular tomogram in the repeated scan also shows increased RNFL thickness in the region affected by the motion artefact.

Movement of the eye during OCT can result in a type of acquisition artefact. This case is a good example of red disease, in which the superior RNFL is incorrectly interpreted as thin due to motion artefact. It also highlights the important components of OCT ONH/RNFL interpretation, which include both a ‘radiologic’ assessment of the circular tomogram, thickness map, and deviation map, as well as a ‘stockbroker’ assessment of RNFL thickness values, the TSNIT plot, and guided progression analysis trends. Radiologic assessment provides important context for stockbroker RNFL metrics, allowing for holistic OCT analysis.
Learning Objectives:
1. Appreciate the importance of both numerical and spatial assessment of visual field and OCT testing.
2. Know the different types of artefacts on OCT RNFL.
3. Understand how motion artefact can result in red disease.
bottom of page